
CURRENT AND ARCHIVED COMMENTARIES...
Assessing Opportunities in an Overvalued Market
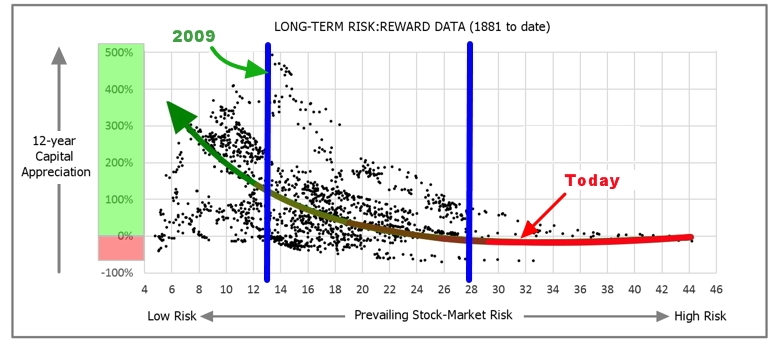
The market has had a robust recovery from the 2009 financial-crisis low, one that RAM took full advantage of at that time and since. Now the market rally has put its valuation at a level at which one might conclude the probabilities of a loss are high. The chart below shows the relationship between market valuations at the time of an investment and their subsequent long-term returns. It covers the past 125 years. Not surprisingly the higher the prevailing market-risk at the time of the investment the lower the 12-yr stock-market gain that followed. At the 2009 lows the market risk was 12 offering both the probability of a very high long-term return and a very low probability of a loss. The subsequent rally now puts it at 28, a level at which the severest long-term losses and lowest returns occurred.
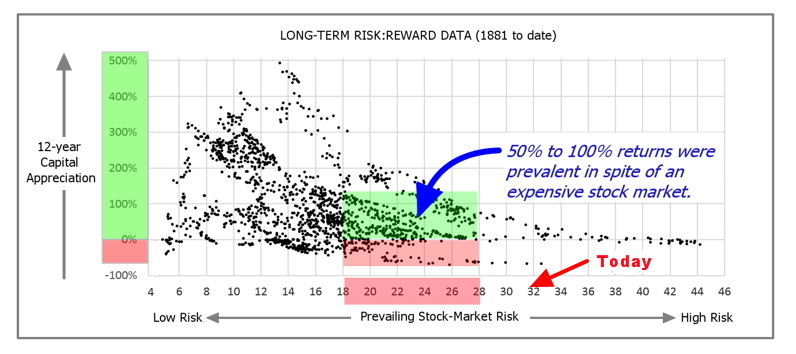
One might conclude that investing now would be unwise but a closer look reveals that conclusion could be detrimental to the long-term success of one’s portfolio. While the probability of a low or negative return is higher than at other levels, the evidence also shows there is a significantly higher proportion of returns in the 50% to 100% range that, under the appropriate investment process, we believe offers a more than reasonable risk/reward opportunity.
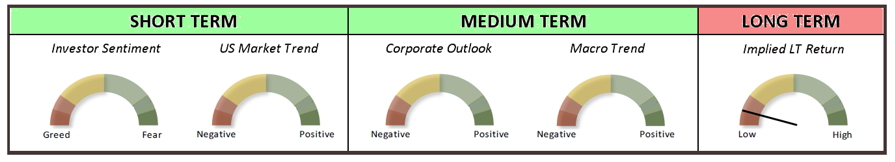
Our appreciation of this fact is why RAM’s investment process, while factoring in long-term market-valuation risk, also continually accesses the short-term factors (investor sentiment and market trend) and medium term factors (corporate outlook and macro trend) that can override long-term valuation concerns allowing RAM the opportunity to capture higher returns when they occur in spite of high stock-market valuations.
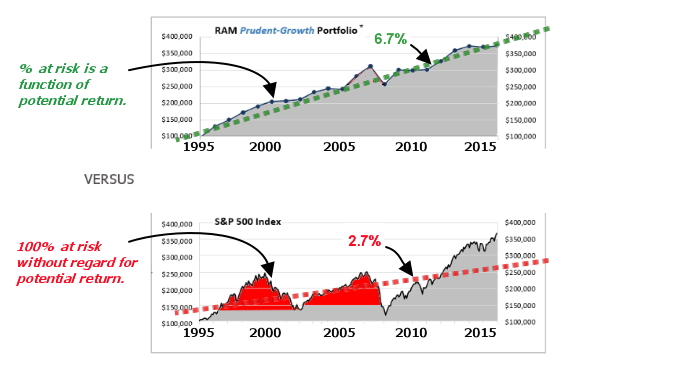
When compared to the S&P 500 Index below, RAM’s 20-year performance, we believe, demonstrates the effectiveness of our process to capture returns in expensive markets not found in traditional fully invested mutual-fund and ETF alternatives, and/or low-yielding cash.
Archive:
April 2017 - Trump Economics: Perception versus Reality.
September 2016 - Can the market withstand a liquidation at the Fed?
May 2016 - Bullish on RAM! But bearish on the market?
February 2016 - RAM's Short-term Sentiment Indicator triggers increased stock allocation.
January 2016 - Global stock markets break support.
* DISCLOSURE
Past performance is not indicative of future results.
Under no circumstances should the information contained herein be used or considered as an offer to sell, or a solicitation of an offer to purchase, any security or investment service. The information presented herein is presented in summary form and is, therefore, subject to qualification and further explanation.
A Single Managed Account (SMA) is an actively managed portfolio. There is no guarantee that any investment will achieve its objectives, generate positive returns, or avoid losses. The SMA may purchase ETFs. The risks and volatility of these investments may be magnified as they may include leverage, which magnifies the changes in the value of the ETF or Underlying Fund. The SMA will incur a loss as a result of a short position if the price of the short position instrument increases in value between the date of the short position sale and the date on which the SMA purchases an offsetting position. The SMA’s losses are potentially unlimited in a short position transaction. A higher portfolio turnover will result in higher transaction and brokerage costs.
Investors should carefully consider the investment objectives, risks, charges and expenses of an SMA account offered by RAM Capital Management LLC. Any performance data quoted here represents past performance. Current and future performance may be lower or higher than that experienced in the past. Investment return and principal value will fluctuate, so that SMA accounts, when closed, may be worth more or less than their original cost. Past performance is no guarantee of future results.
RAM Capital Management LLC does not guarantee the accuracy or completeness of information posted on its site or within its reports, nor does it assume any liability for any loss that may result from reliance by any person upon any such information or opinions. Such information and opinions are subject to change without notice and are for general information only.
The performance shown for RAM in any chart is for a single-managed account (SMA) managed on a fully-discretionary basis by RAM Capital Management LLC (RCM) and that adheres fully to RCM’s investment process and portfolio execution. In some cases, due to the modest size of the account or client restrictions placed on the account, an SMA account’s performance may vary.
For the performance of the Prudent-Growth Portfolio the past performance for January 1, 1996 to September 30, 2010 is for the RAM Capital L.P fund. The prior performance is net of management fees (1% per annum), and net of other expenses. Also prior performance does not include the effect of the LP’s performance fee, which does not apply to SMA’s. On October 1, 2010 the partnership was converted to, and it’s performance ported to, a mutual fund adhering to the Investment Companies Act of 1940 and regulated by the SEC. Past performance since the conversion are net of management fees (1%) and expenses (0.25%). The latter does not apply to SMA’s although all commission and other charges, fees and expenses are the responsibility of the SMA owner. The LP and the mutual fund were managed in the same style and by the same portfolio manager and advisor, RAM Capital Management LLC, since the fund’s inception on January 1, 1996. The past performance is not necessarily an indication of how an SMA will perform in the future.
The S&P 500 Index is an unmanaged composite of 500 large capitalization companies. This index is widely used by professional investors as a performance benchmark for large-cap stocks. You cannot invest directly in an index.
The information contained on RAM’s website and in RAM’s reports may not be published, broadcast, rewritten or otherwise distributed without prior written consent from RAM Capital Management LL C.
Investors should carefully consider the investment objectives, risks, charges and expenses of RAM Capital Management LLC's (RCM) services. This and other important information about RCM is contained in its Form ADV, and, along with performance current to the most recent month, can be obtained by contacting us.
The information contained herein, including any attachment(s), is provided by RAM Capital Management, LLC ("RCM") to the intended recipient solely for informational purposes. Any dissemination, re-distribution or other use of this message by any recipient is unauthorized. Past performance may not necessarily be repeated and is no guarantee or projection of future results. The information in this document has been obtained from sources believed to be reliable, but RCM does not represent that it is accurate or complete. Data presented is not audited and includes estimates, which may not represent actual results. RCM assumes no obligation to update or correct estimates.